WWE Champions: The First Dollar
A Growth Diagnosis From 2,945 Player Reviews and 42 Screens of Firsthand Play
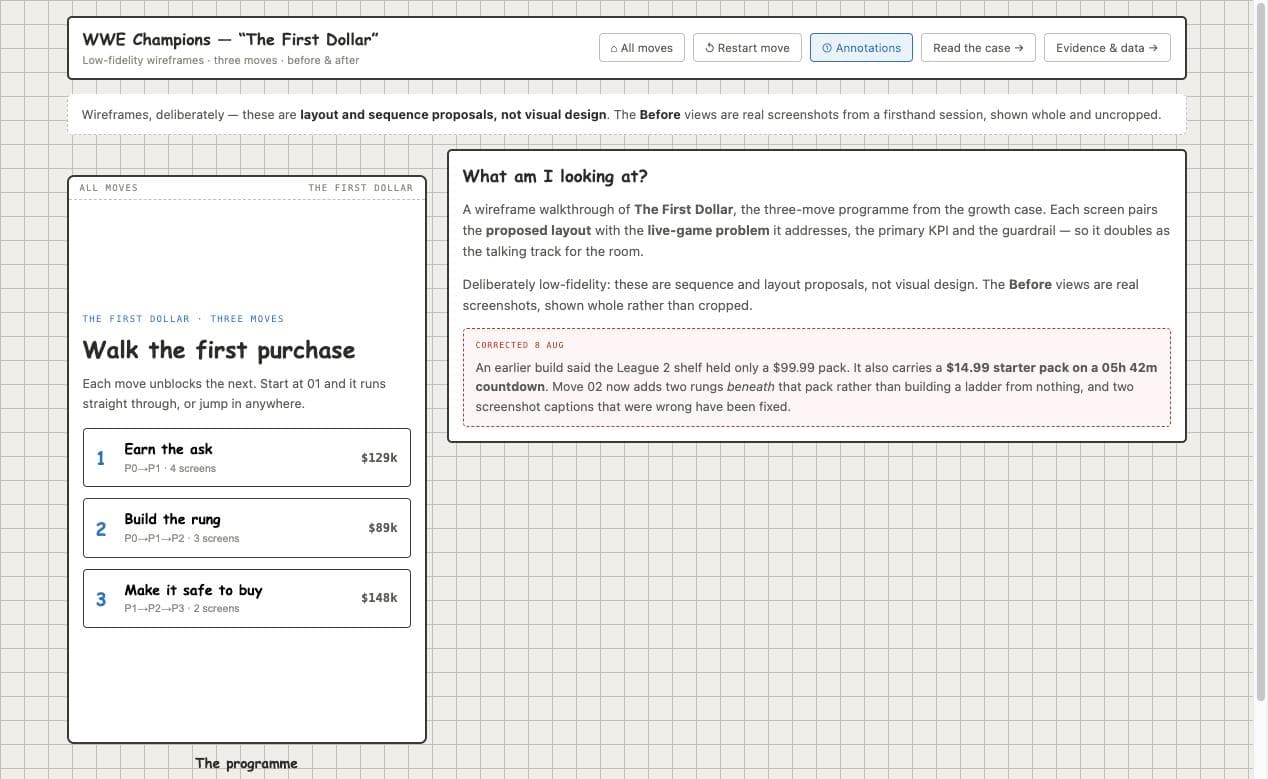
An independent growth analysis of WWE Champions, built from a firsthand new-player playthrough and a quantitative read of 2,945 public player reviews. It ships as three linked artifacts: a structured case, a nine-act evidence page where every claim traces to a source, and an interactive wireframe prototype of the three proposed moves with a before/after toggle. Written as preparation for a Senior Growth PM interview, finished as a public case.
Visit Live Site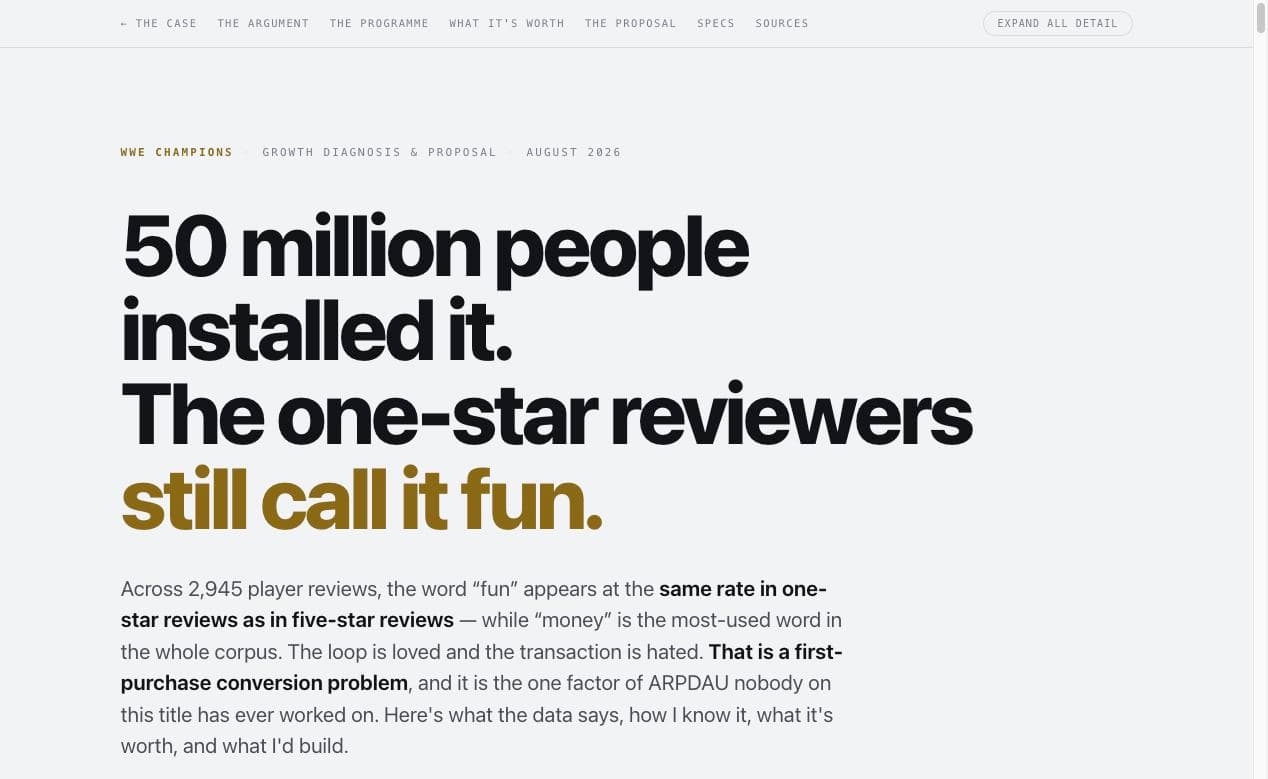
The Problem
Public evidence on a live mobile game is almost entirely qualitative, and the temptation is to treat loud player complaints as a diagnosis. That produces confident recommendations built on a vocal minority. The harder problem is building an argument that survives contact with internal telemetry you don't have — which means naming, up front, exactly which numbers you are missing and which query would settle each one.
Research & Discovery
A new account was played to League 2 across a firsthand activation session, capturing 42 screenshots of the onboarding and first-purchase window. Every claim in the case cites a specific screen, and captions were re-verified against the images before publishing
Google Play's full rating histogram — 402,333 ratings at 4.36★ against 50M+ installs — is used as the honest denominator. Only 8.1% of raters write text, which is why the written corpus skews negative and is quoted only for what people say, never for how many feel it
Onboarding complaints are just 3% of the corpus, which is expected: players who churn on day one don't come back to write reviews. The cohort this case is about is doubly silent, because nobody writes a review about a purchase they didn't make
Strategy
Two-Factor Framing
ARPDAU = (payers ÷ DAU) × ARPPU. ARPPU is at ceiling and defended; payer rate has never been worked. That's the opportunity.
Evidence Tiers
Every claim tagged verified fact, player signal, or named data gap. Sentiment is a hypothesis to test, not a measurement.
Marginal Value
New payers priced at the marginal converter's 180-day value, because a cheaper rung raises conversion and lowers first-purchase value at once.
Published Corrections
Where the analysis was wrong, the correction and its cost to the model are printed in the case rather than edited away.
Key Decisions
Tagged every claim as verified fact, player-reported signal, or a named data gap requiring internal telemetry. Player sentiment is treated as a hypothesis to validate against funnel and cohort data, never as a measurement
Priced added payers at the marginal converter's 180-day value rather than the incumbent's, because adding a cheap rung raises conversion and lowers average first-purchase value at the same time. Modeling them at the incumbent's value would have flattered the result
Excluded every third-party revenue estimate, because the sources behind them sit behind a login and can't be re-verified. The competitive table is built only on store-API fields that re-fetch in a single call
Shipped the prototype as deliberately low-fidelity wireframes, with the 'before' views as real screenshots shown whole and uncropped. Sequence and layout are the proposal; visual design is explicitly not
Published the model as a model, not a forecast — every input editable in the page and backed by a committed JSON file, so a reader can disagree with an assumption and immediately see what it costs
Results & Impact
2,945
Player Reviews Analyzed
+$367k
Modeled Annual Lift
42
Screens of Firsthand Play
- Shipped three linked artifacts: a case structured situation → cohort → blockers → priority → programme → tradeoffs → recommendation, a nine-act evidence page, and an interactive wireframe prototype of the three moves with a before/after toggle
- Analyzed 2,945 de-duplicated reviews — 474 from the iTunes customer-review feed, 2,471 from Google Play — sampled across newest, highest, lowest, and most-helpful orderings, then ran word frequency, keyword-family reach, and per-rating divergence
- Found the argument in two numbers: 'fun' appears at nearly the same rate in 1–2★ reviews as in 4–5★ reviews, a skew of −1.1 points, while 'money' is the corpus's most-used word and skews +26.7. People who don't care about spending don't talk about money
- Documented the store shelf from firsthand play: at League 2 it leads with a $99.99 pack and its cheapest item is a $14.99 starter pack on a countdown — three to five times the genre's conventional entry price, with nothing beneath it
- Built a transparent ROI model in Python with every input editable in the page. Base case moves ever-pay conversion from 2.00% to 2.80% for +$367k a year and +2.2% ARPDAU, against a retention-led portfolio that scores a bigger revenue number and moves the target metric the wrong way